South Florida Real Estate Market Update: July 2026
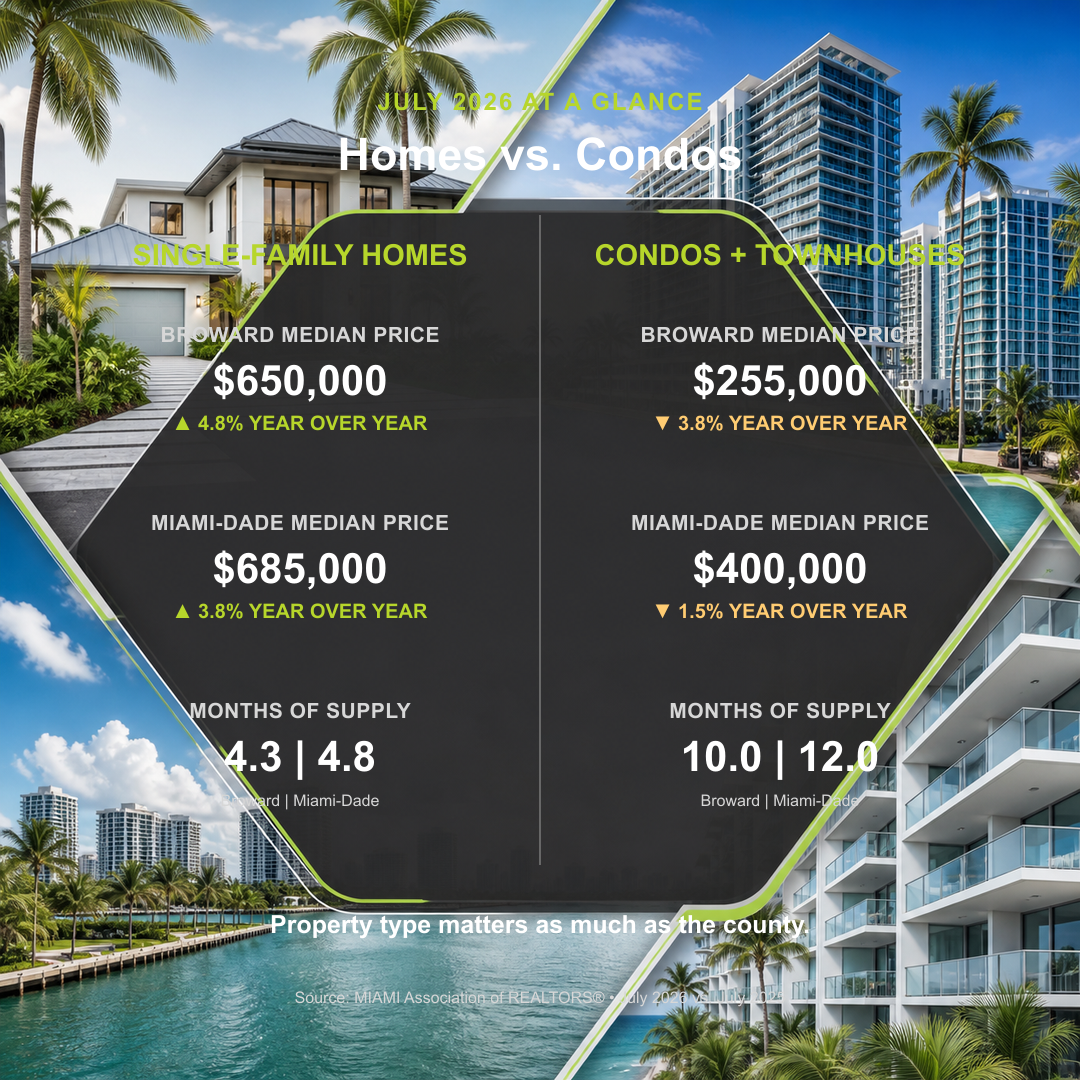
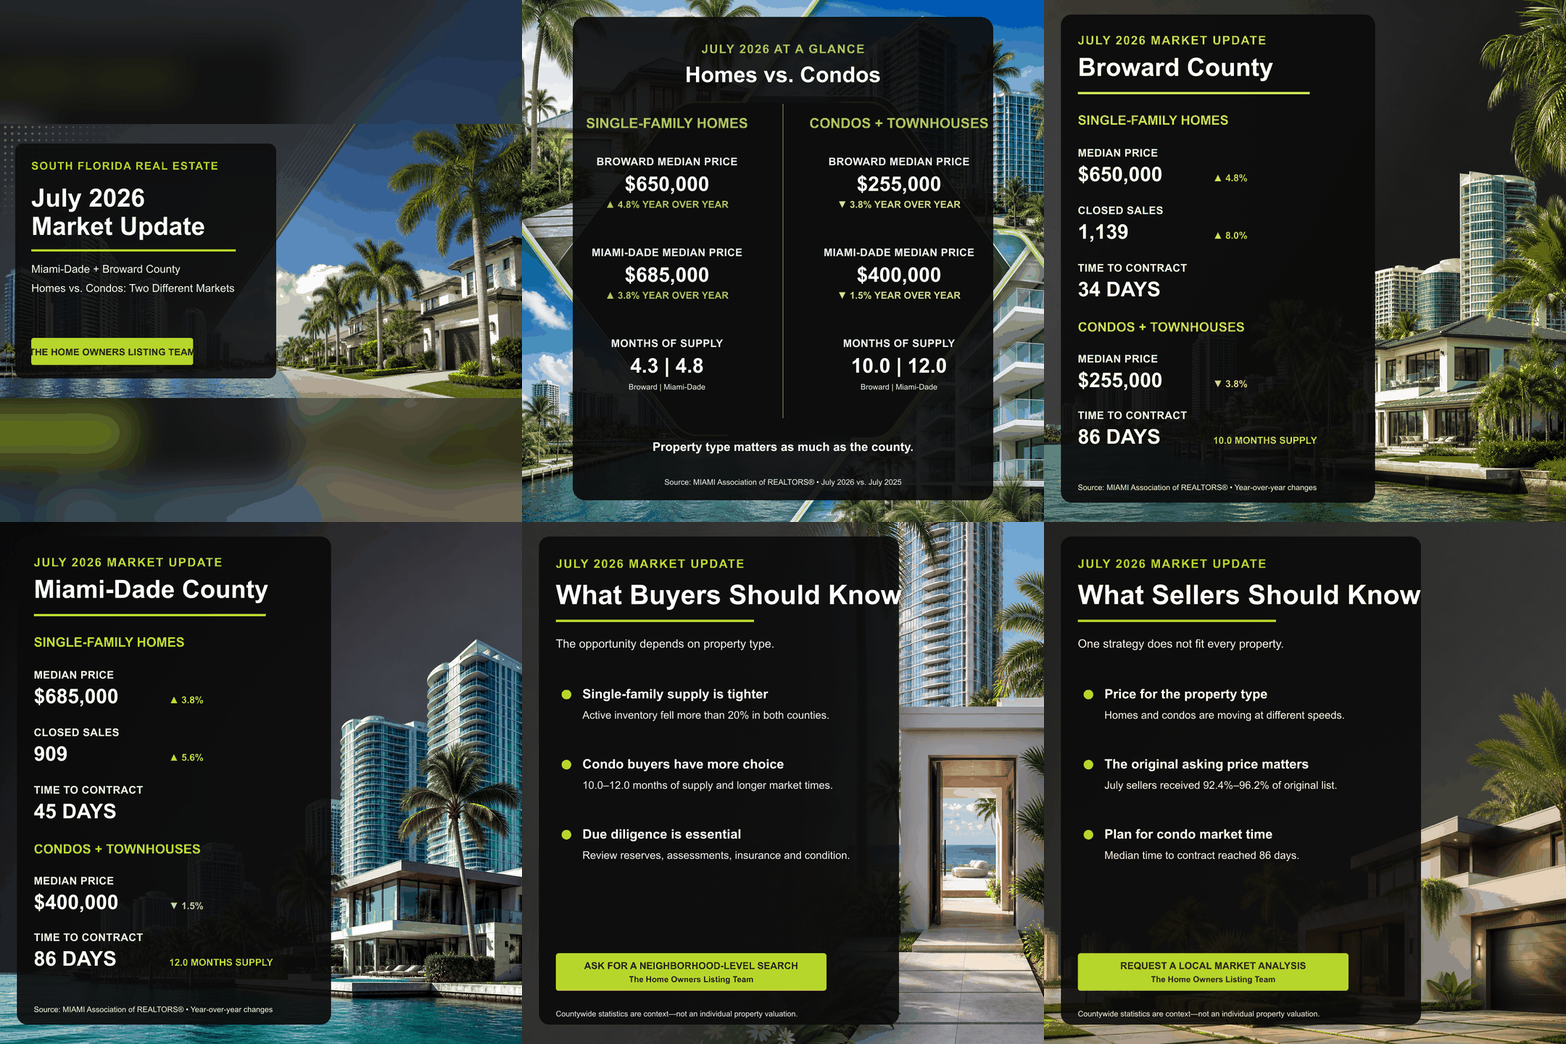
July 2026 produced two distinct South Florida housing markets. Single-family homes posted higher closed sales and median prices in both Miami-Dade and Broward counties. Condos and townhouses moved more slowly, with longer contract times, softer median prices and considerably more months of supply than detached homes.
What happened in the South Florida housing market in July 2026?
Single-family homes strengthened in both counties. Broward closed sales rose 8.0% and the median price increased 4.8%. Miami-Dade closed sales rose 5.6% and the median price increased 3.8%. Condo and townhouse median prices declined in both counties, while median time to contract reached 86 days.
July 2026 South Florida Market at a Glance
| County and property type | Closed sales | Median price | Time to contract | Active listings | Months of supply |
|---|---|---|---|---|---|
| Broward single-family | 1,139 (+8.0%) | $650,000 (+4.8%) | 34 days (-20.9%) | 4,416 (-24.9%) | 4.3 (-28.3%) |
| Broward condos and townhouses | 1,018 (-2.8%) | $255,000 (-3.8%) | 86 days (+21.1%) | 9,533 (-15.8%) | 10.0 (-16.7%) |
| Miami-Dade single-family | 909 (+5.6%) | $685,000 (+3.8%) | 45 days (+2.3%) | 4,275 (-22.8%) | 4.8 (-27.3%) |
| Miami-Dade condos and townhouses | 1,026 (+11.4%) | $400,000 (-1.5%) | 86 days (+32.3%) | 11,324 (-11.8%) | 12.0 (-14.9%) |
All percentage changes compare July 2026 with July 2025. A decline in inventory or market time indicates tighter market conditions, not necessarily an improvement for every buyer or seller.
Broward County Single-Family Homes Gained Momentum
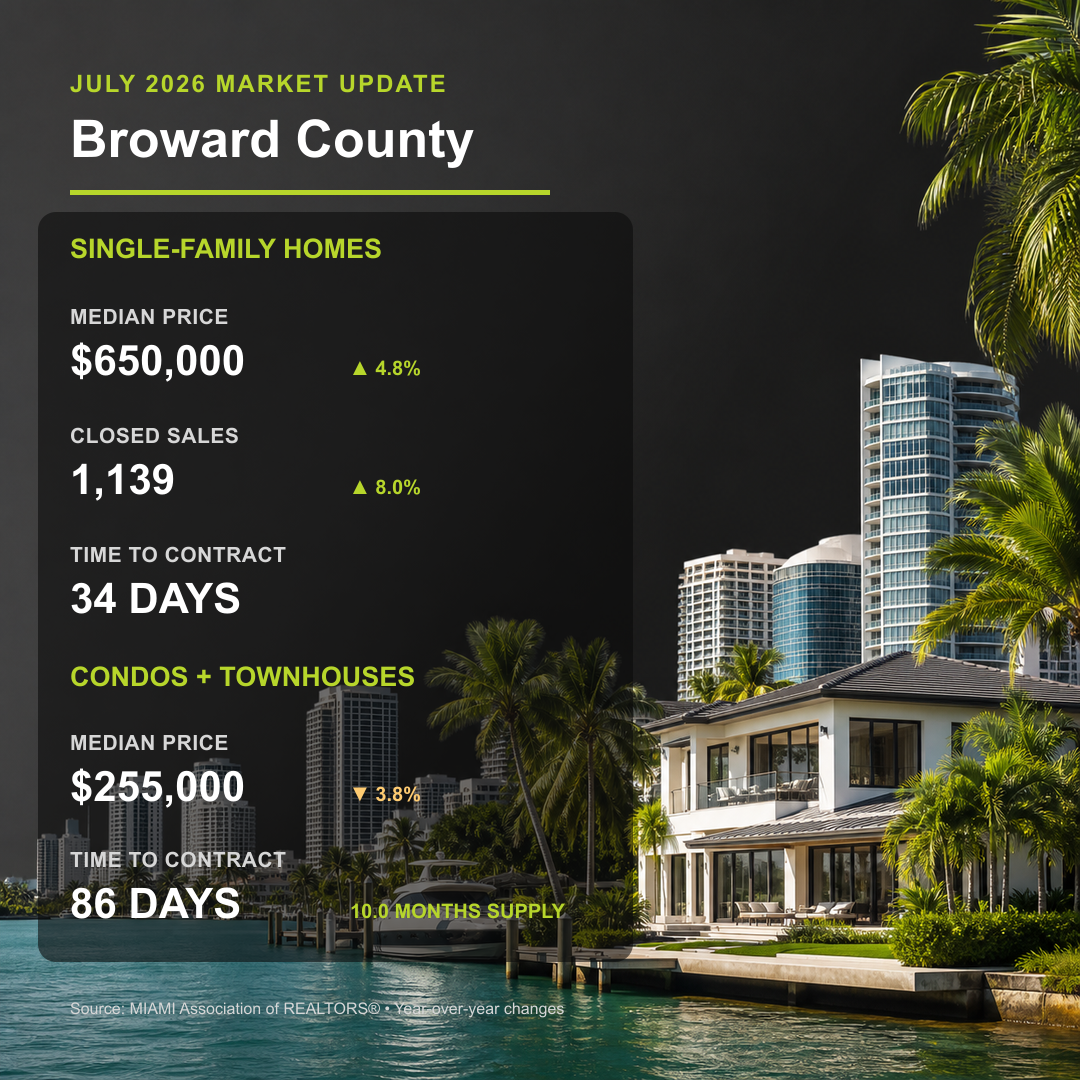
Broward’s detached-home market delivered some of July’s strongest results. Closed sales rose 8.0% to 1,139, while the median sale price increased 4.8% to $650,000. The average sale price reached $920,415, up 11.7%, and total dollar volume climbed 20.6% to approximately $1.0 billion.
Homes also moved more quickly. Median time to contract fell from 43 days to 34 days, and median time to sale declined from 81 days to 74 days. Sellers received a median 96.2% of their original asking price, compared with 95.0% one year earlier.
Supply tightened substantially. Active listings fell 24.9% to 4,416, and months of inventory dropped from 6.0 to 4.3. New listings were down 8.2%, even as new pending sales increased 5.0%.
Broward Condos and Townhouses Remained Slower
Broward condo and townhouse sales declined 2.8% to 1,018. The median sale price fell 3.8% to $255,000, although the average sale price rose 7.9% to $371,961 and dollar volume increased 4.9% to $378.7 million.
The difference between the median and average results suggests higher-priced transactions affected the average; it does not mean the typical property rose by 7.9%.
Median time to contract increased from 71 to 86 days, and median time to sale rose from 108 to 122 days. Sellers received a median 92.4% of original list price. There were 9,533 active listings and 10.0 months of supply. Both measures were lower than in July 2025, but remained much higher than Broward’s single-family levels.
Miami-Dade Single-Family Sales and Prices Increased
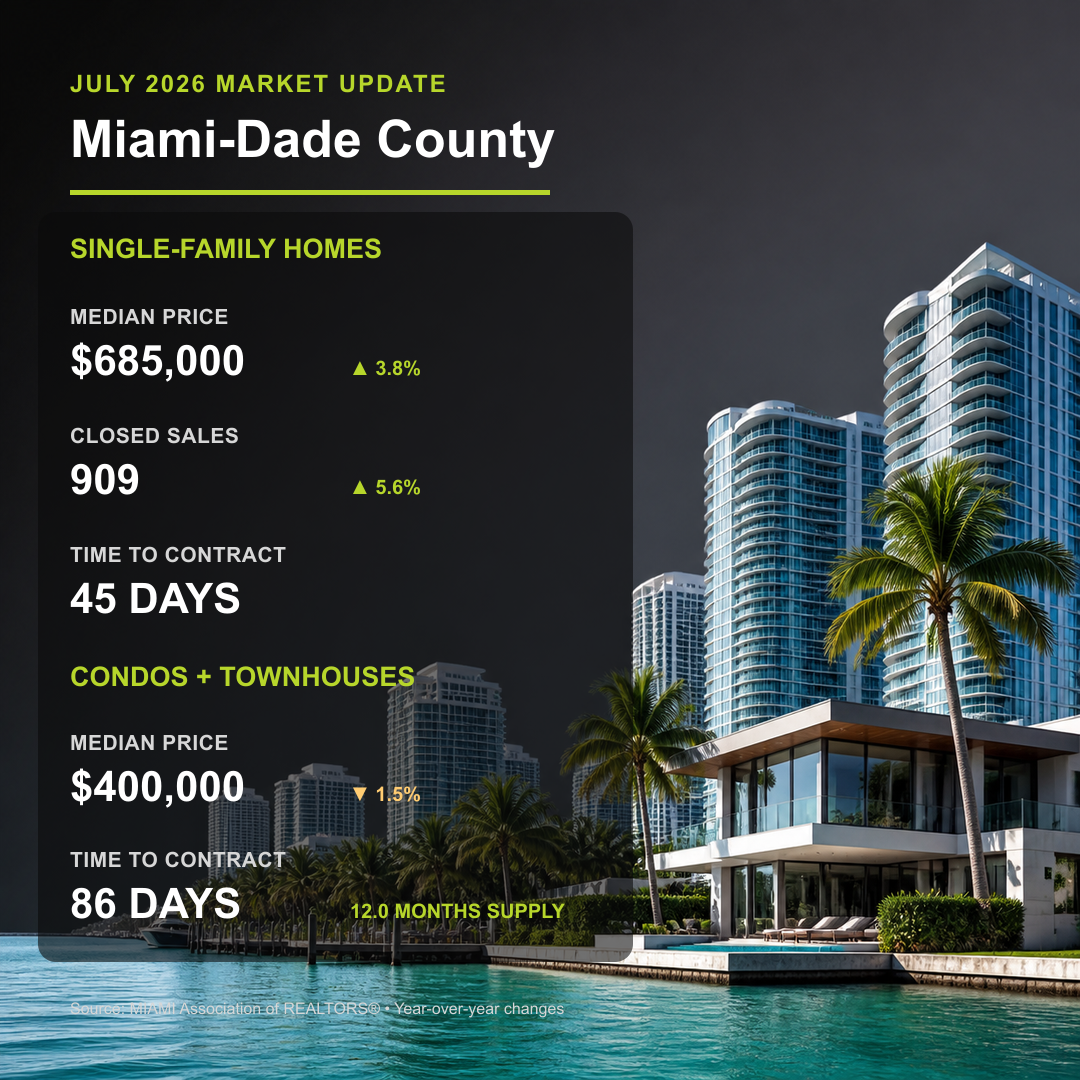
Miami-Dade recorded 909 single-family closings, up 5.6% from July 2025. The median sale price rose 3.8% to $685,000, the average sale price increased 10.4% to $1,396,322, and dollar volume advanced 16.5% to approximately $1.3 billion.
Market time was comparatively steady. Median time to contract increased by one day to 45 days, and median time to sale rose from 85 to 88 days. Sellers received a median 95.5% of their original asking price, up from 94.1%.
Active inventory fell 22.8% to 4,275, while months of supply dropped from 6.6 to 4.8. New listings declined 13.8%, and new pending sales decreased 3.5%. The pending-sales decline is worth monitoring because pending activity can offer an early indication of future closings.
Miami-Dade Condo Sales Rose, but Market Times Lengthened
Miami-Dade condo and townhouse closings increased 11.4% to 1,026, even as the median sale price slipped 1.5% to $400,000. The average sale price fell 17.8% to $689,289, and dollar volume declined 8.4% to $707.2 million.
Properties took longer to sell. Median time to contract rose from 65 to 86 days, while median time to sale increased from 107 to 125 days. Sellers received a median 93.1% of original list price.
Miami-Dade had 11,324 active condo and townhouse listings and 12.0 months of supply. Both figures declined year over year, but this segment still offered the greatest supply and longest market times among the four county and property-type combinations.
What South Florida Buyers Should Know
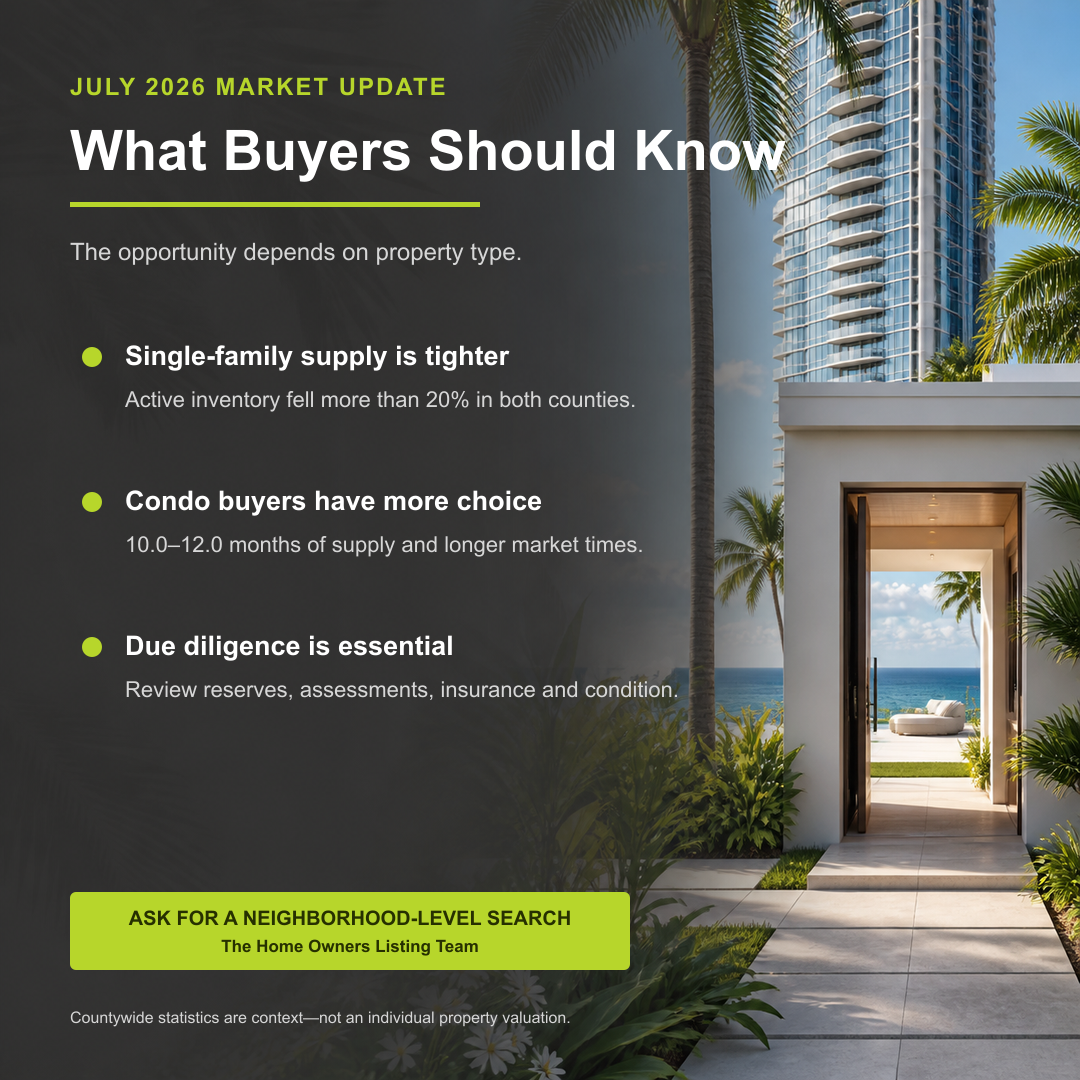
- Single-family supply is tighter. Active detached-home inventory fell by more than 20% year over year in both counties.
- Condo and townhouse buyers may have more negotiating room. These properties took a median 86 days to go under contract and carried 10.0 months of supply in Broward and 12.0 months in Miami-Dade.
- Due diligence remains property-specific. Association finances, reserves, assessments, insurance, inspections and building condition can materially affect value and ownership costs.
What South Florida Sellers Should Know
- Property type should shape the pricing strategy. The single-family and condo-townhouse markets are not moving at the same pace.
- Original asking price matters. July sellers received a median 95.5% to 96.2% of original list price for single-family homes, compared with 92.4% to 93.1% for condos and townhouses.
- Longer condo market times require planning. An 86-day median contract period does not include the additional time needed to close.

Frequently Asked Questions
Is South Florida a buyer’s or seller’s market in July 2026?
The data is mixed. Single-family homes had 4.3 months of supply in Broward and 4.8 months in Miami-Dade, with higher sales and median prices. Condos and townhouses had 10.0 and 12.0 months of supply, respectively, along with longer market times and lower median prices. Conditions depend on property type, location, price range and condition.
What was the median single-family home price in July 2026?
The median single-family sale price was $650,000 in Broward County and $685,000 in Miami-Dade County.
What was the median condo and townhouse price in July 2026?
The median condo and townhouse sale price was $255,000 in Broward County and $400,000 in Miami-Dade County.
How long did South Florida homes take to go under contract?
Median time to contract was 34 days for Broward single-family homes, 45 days for Miami-Dade single-family homes, and 86 days for condos and townhouses in both counties.
Was South Florida housing inventory rising or falling?
Compared with July 2025, active inventory fell in all four segments. The decline ranged from 11.8% for Miami-Dade condos and townhouses to 24.9% for Broward single-family homes.
Get a Neighborhood-Level Market Analysis
Countywide statistics provide context, but they do not determine the value or negotiating position of an individual property. Get current comparable sales, active competition and a strategy based on your specific South Florida move.
Request a Local Market Analysis Call (954) 342-6180Source: MIAMI Association of REALTORS®, July 2026 Broward County and Miami-Dade County market reports. Statistics compare July 2026 with July 2025 and may be revised. This market update provides general information, not an appraisal, guarantee, financial forecast, or legal, tax, lending, insurance or investment advice. Consult appropriately licensed professionals for property-specific guidance.