The Home Owners Listing Team · MONTHLY MARKET REPORT
September 2026 South Florida Real Estate Market Update
Miami-Dade & Broward County | Single-Family Homes, Condos & Townhouses
Published October 19, 2026
South Florida's September 2026 market presented contrasting trends. Single-family median sale prices rose in Miami-Dade and Broward counties, while condo and townhouse median prices declined. Active listings decreased across all four segments.
Based on Florida Realtors’ September 2026 Monthly Market Detail, released October 16, 2026, this analysis compares September 2026 with September 2025.
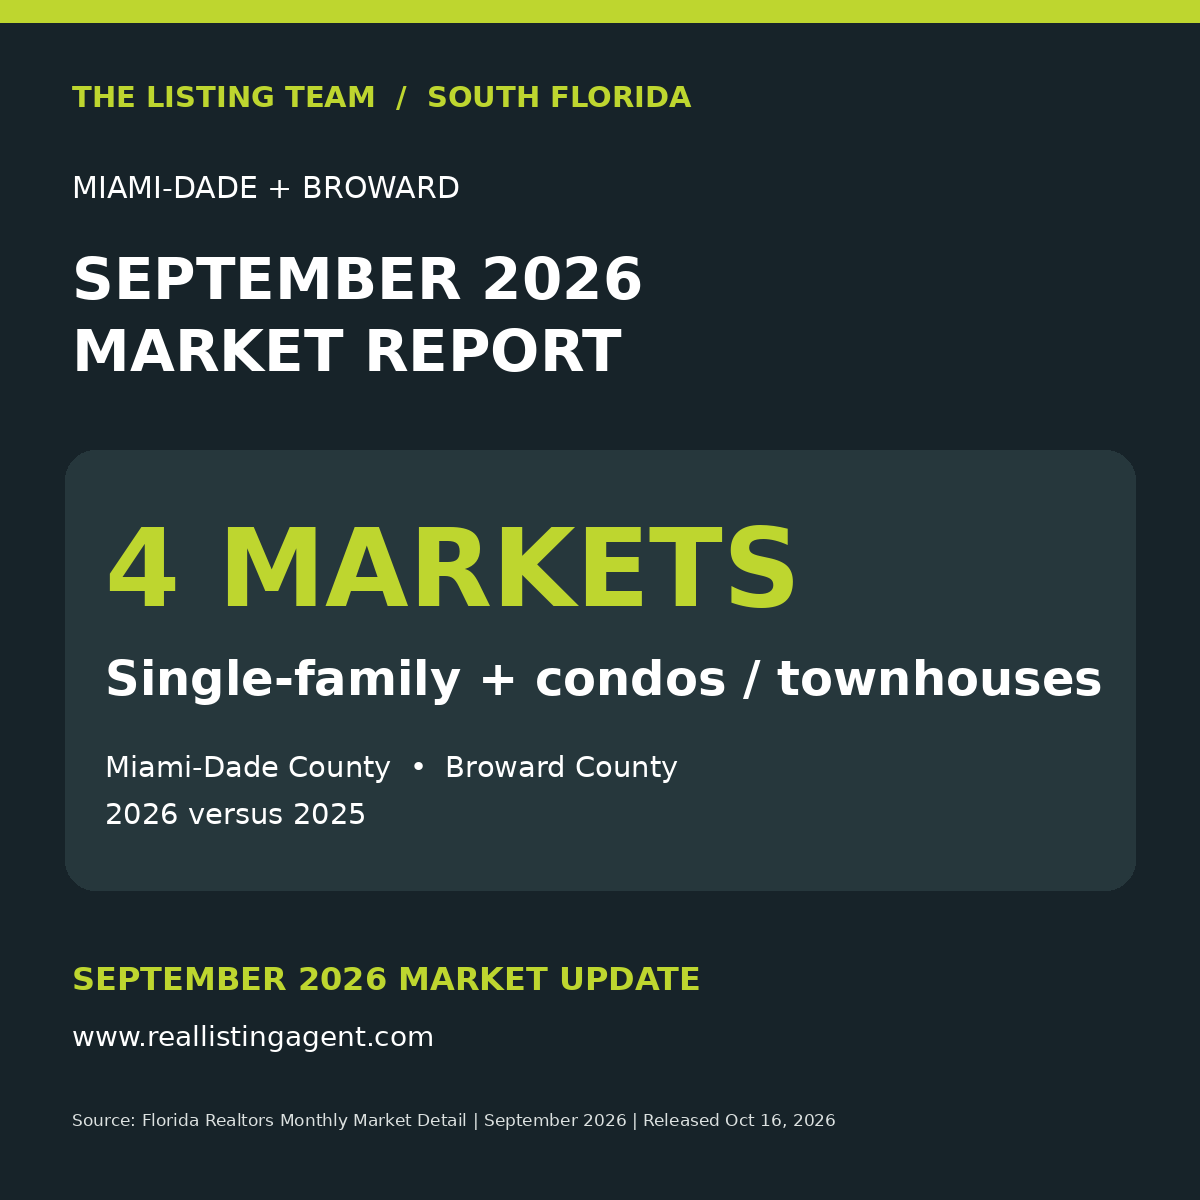
September 2026 market snapshot
| Segment | Closed sales | YoY sales | Active listings | Months supply |
|---|---|---|---|---|
| Miami-Dade single-family | 824 | −4.7% | 4,536 | 5.1 |
| Miami-Dade condos/townhouses | 909 | +0.6% | 11,706 | 12.3 |
| Broward single-family | 974 | −7.1% | 4,351 | 4.2 |
| Broward condos/townhouses | 851 | −12.5% | 9,582 | 10.2 |
Miami-Dade single-family homes: prices rise as sales fall
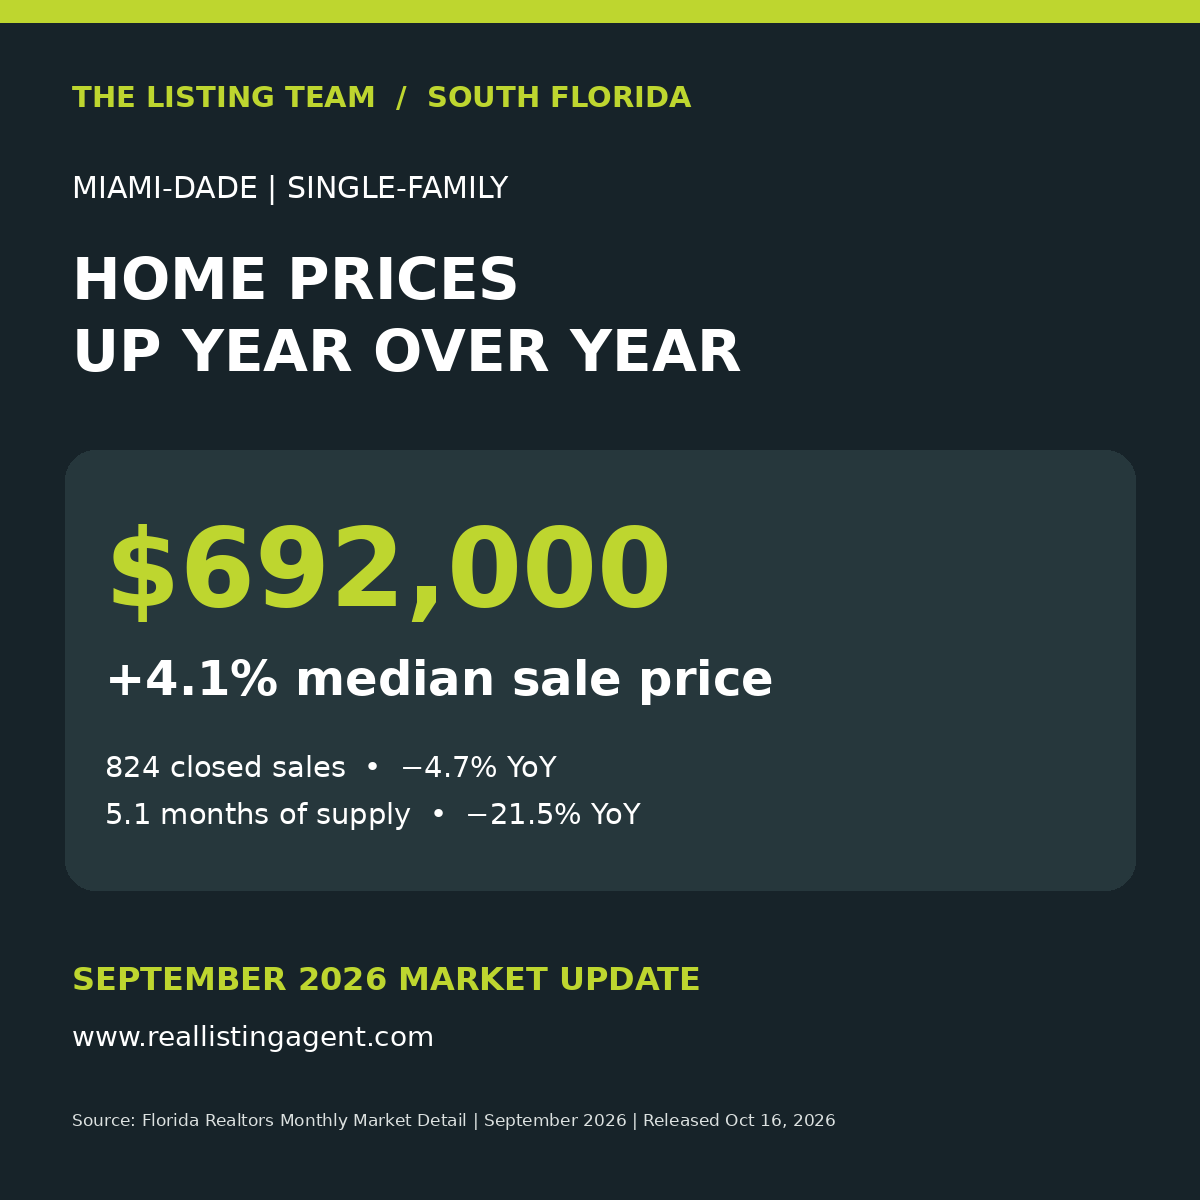
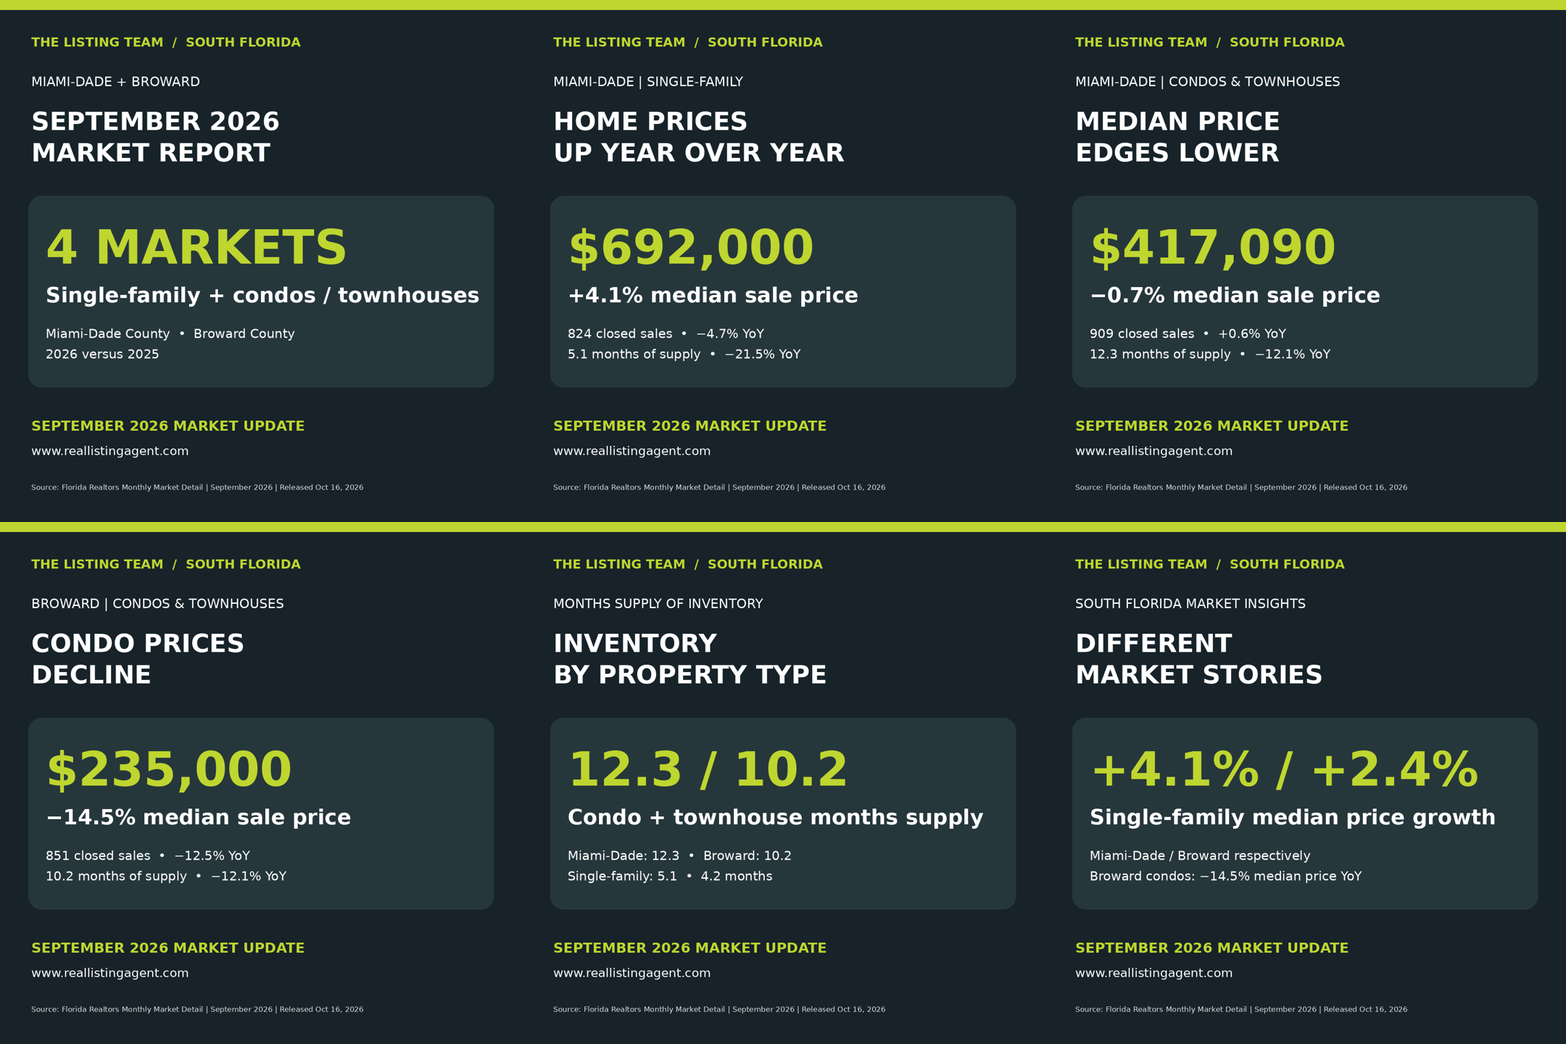
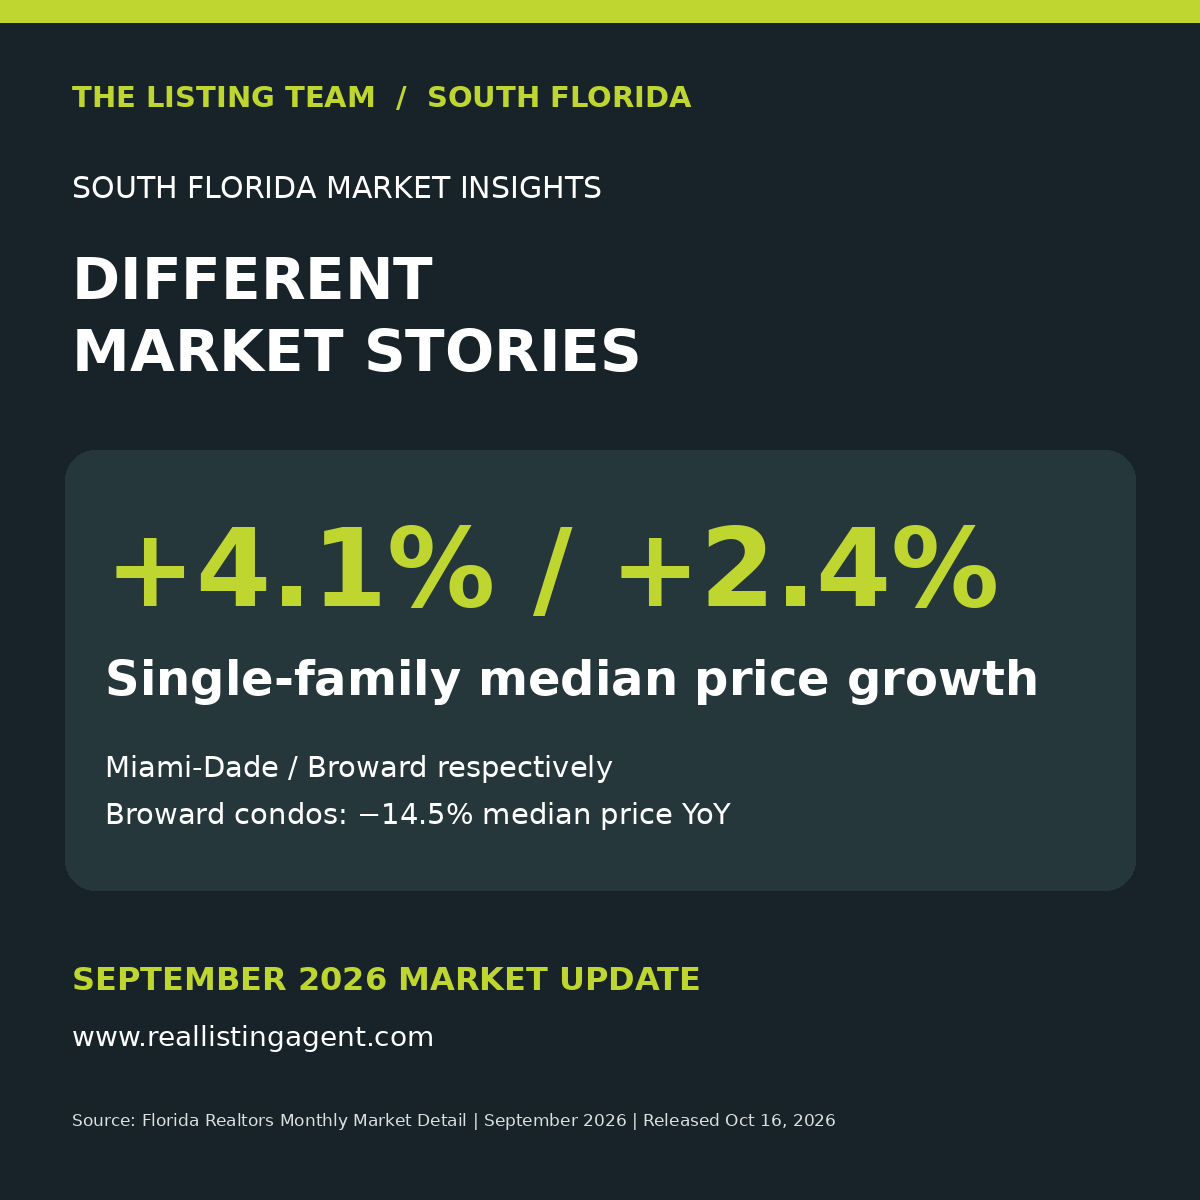
Miami-Dade recorded 824 closed single-family sales , down 4.7% from 865. The median sale price increased to $692,000 , up 4.1% from $665,000. Average sale price reached $1,404,636, a 27.3% increase, while dollar volume increased 21.3% to approximately $1.2 billion.
Median time to contract shortened to 41 days from 50, and median time to sale declined to 80 days from 89. Active inventory fell 16.6% to 4,536 properties, reducing months of supply to 5.1 from 6.5. New pending sales declined 11.6% to 814.
The much larger increase in average sale price than median sale price could reflect changes in the mix of properties sold. The countywide report does not establish the cause.
Miami-Dade condos and townhouses: supply remains elevated
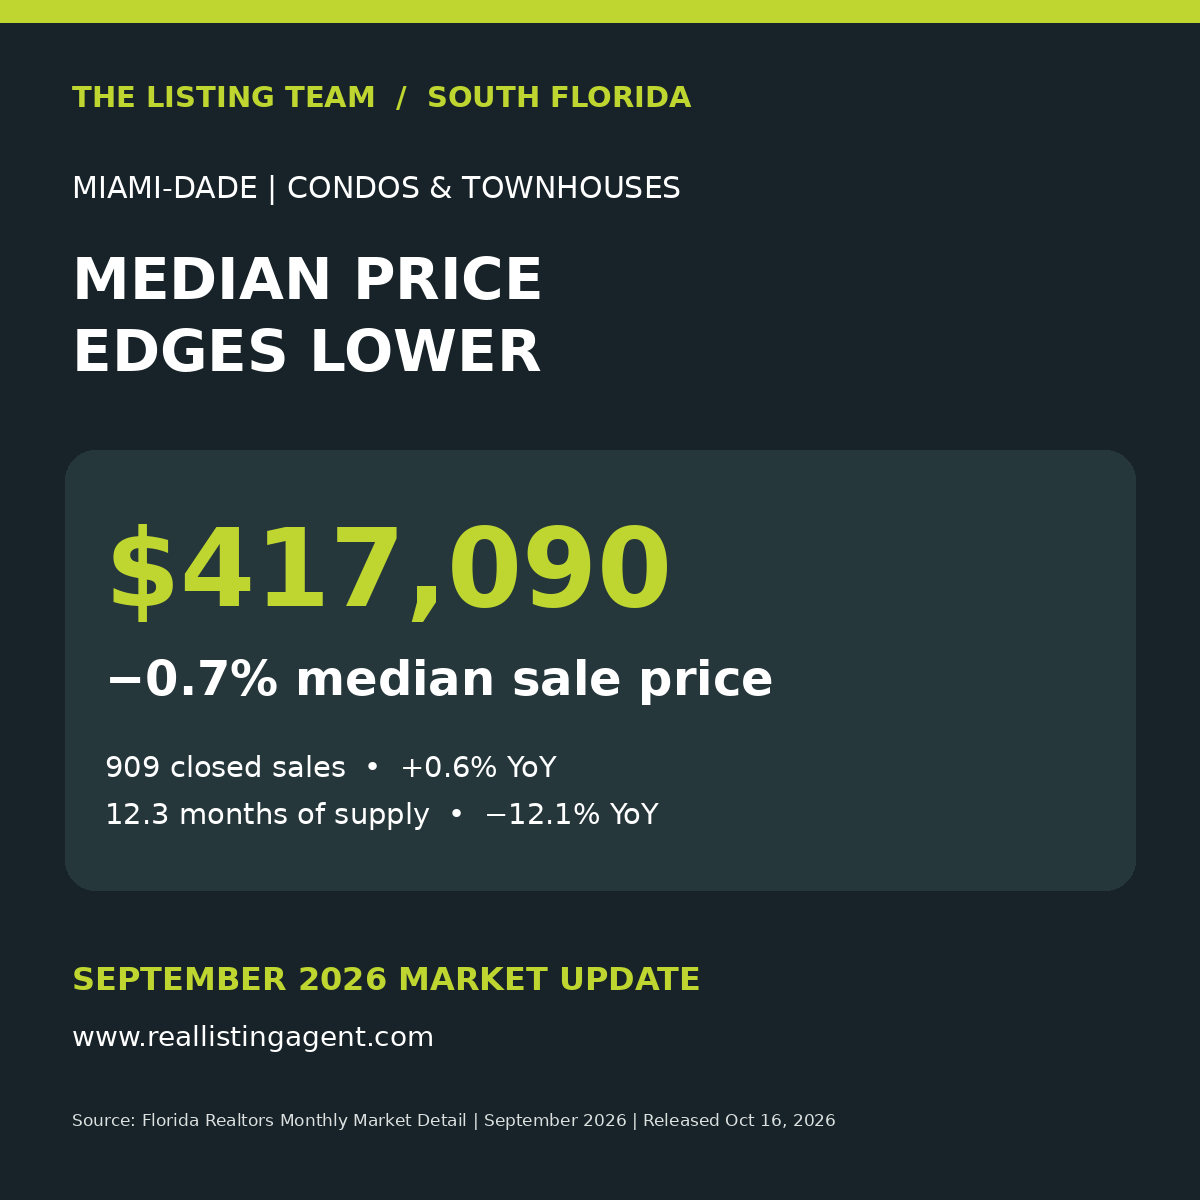
Closed sales increased slightly, from 904 to 909 , a 0.6% gain. Median sale price declined 0.7% to $417,090 , compared with $420,000 one year earlier. Average sale price rose 6.5% to $797,101; dollar volume increased 7.1% to $724.6 million.
Median time to contract fell to 67 days from 75; median time to sale fell to 102 from 115. Active inventory declined 7.2% to 11,706 listings, and months of supply dropped from 14.0 to 12.3 . New pending sales fell 7.5% to 936.
Although available supply decreased, the condo and townhouse market still carried considerably more inventory than single-family homes. Buyers and sellers should examine building-level comparable sales rather than rely solely on countywide statistics.
Broward single-family homes: fewer listings and higher median prices
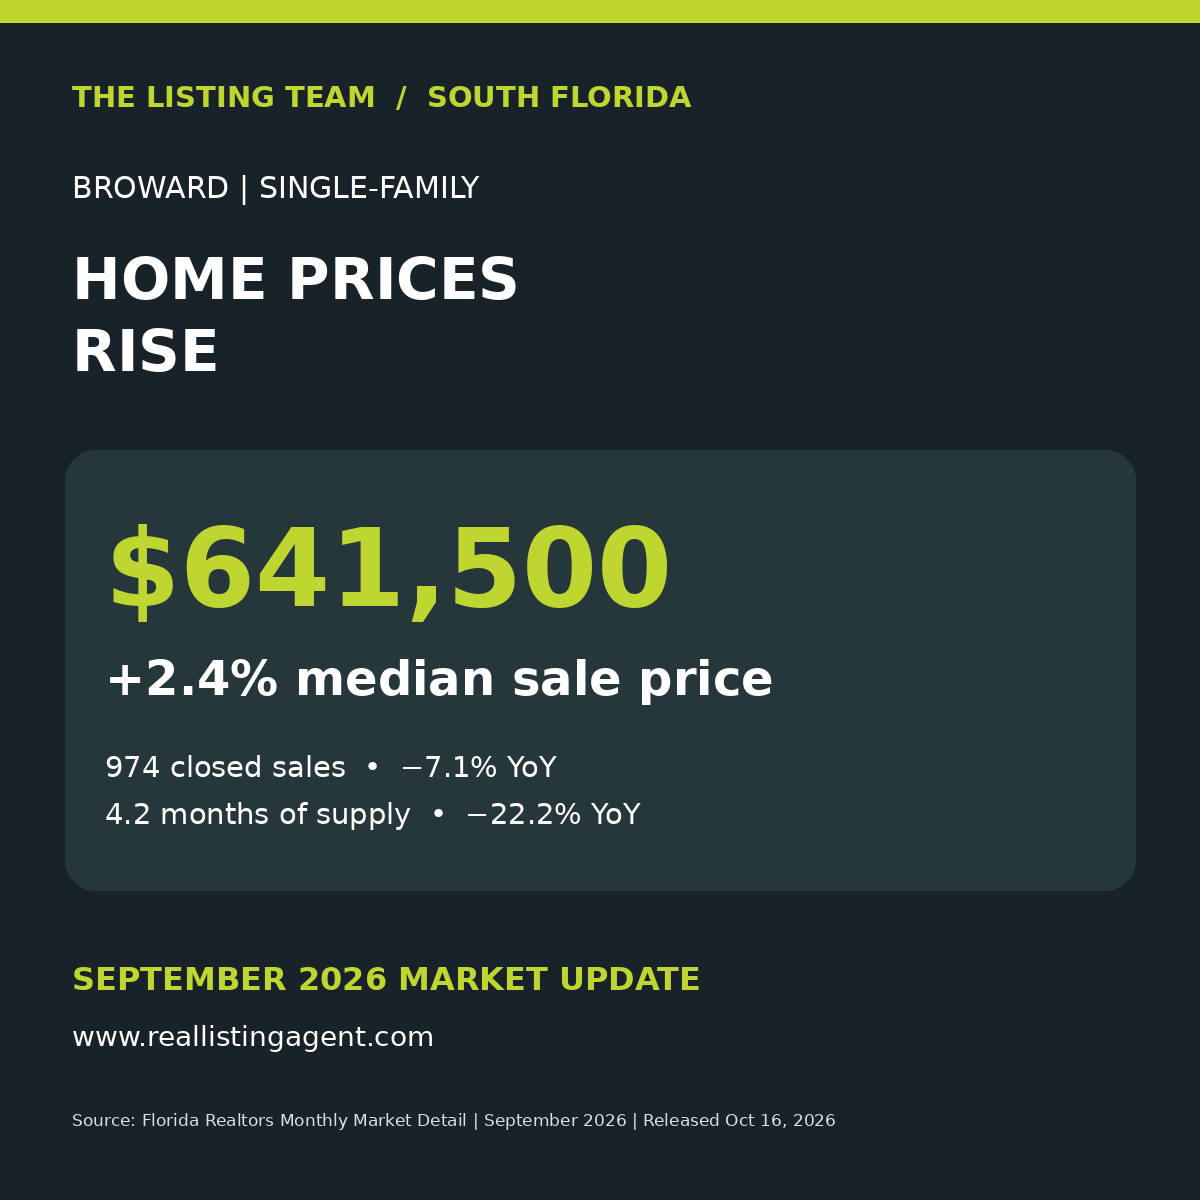
Broward recorded 974 closed single-family sales , down 7.1% from 1,048. Median sale price increased 2.4% to $641,500 , from $626,500. Average sale price rose 5.0% to $822,073, while dollar volume fell 2.4% to $800.7 million.
Median time to contract declined to 39 days from 48, and median time to sale fell to 77 days from 87. Active listings dropped 18.1% to 4,351, with months of supply decreasing from 5.4 to 4.2 . New pending sales decreased 14.9% to 922.
For owners considering selling in Fort Lauderdale and Broward County , reduced inventory can be relevant, but property-specific pricing and recent comparable sales remain critical.
Broward condos and townhouses: median price down 14.5%
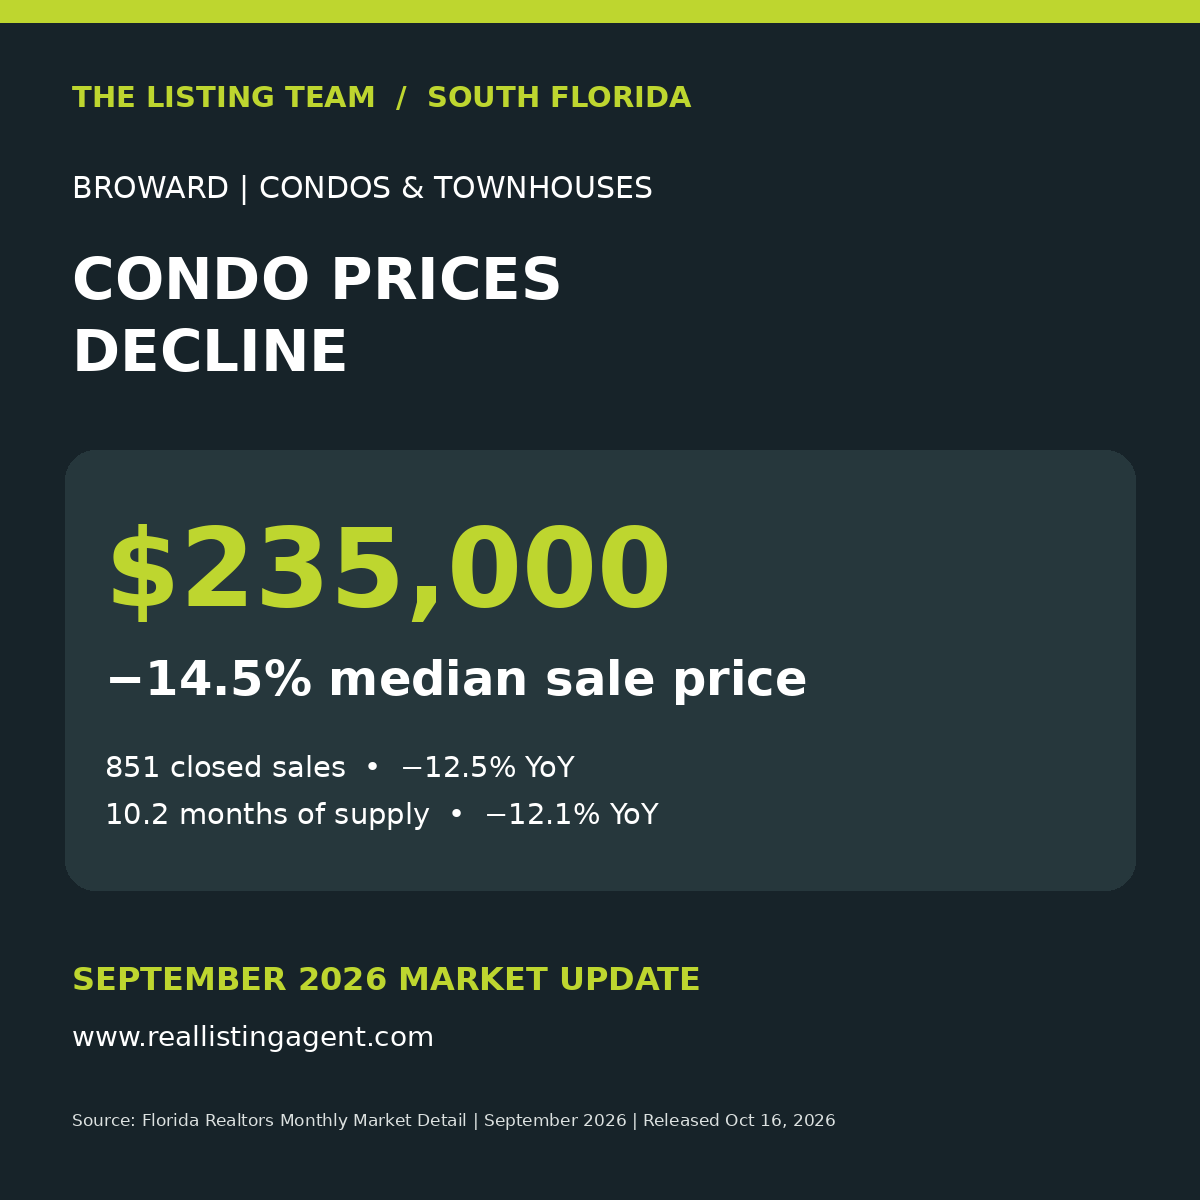
Broward condo and townhouse closed sales declined 12.5% to 851 , from 973. Median sale price declined from $275,000 to $235,000 , a 14.5% decrease. Average sale price declined 5.4% to $348,121, and dollar volume declined 17.2% to $296.3 million.
Median time to contract was 69 days versus 73 last year; median time to sale was 105 versus 111. Active listings declined 12.0% to 9,582, while months of supply fell from 11.6 to 10.2 . New pending sales decreased 15.2% to 889.
The median-price decline does not prove every condo lost 14.5% in value. Transaction mix, building location and property characteristics can affect countywide median figures. Buyers should also review association finances, insurance, assessments and financing eligibility.
September inventory: all four segments had fewer active listings
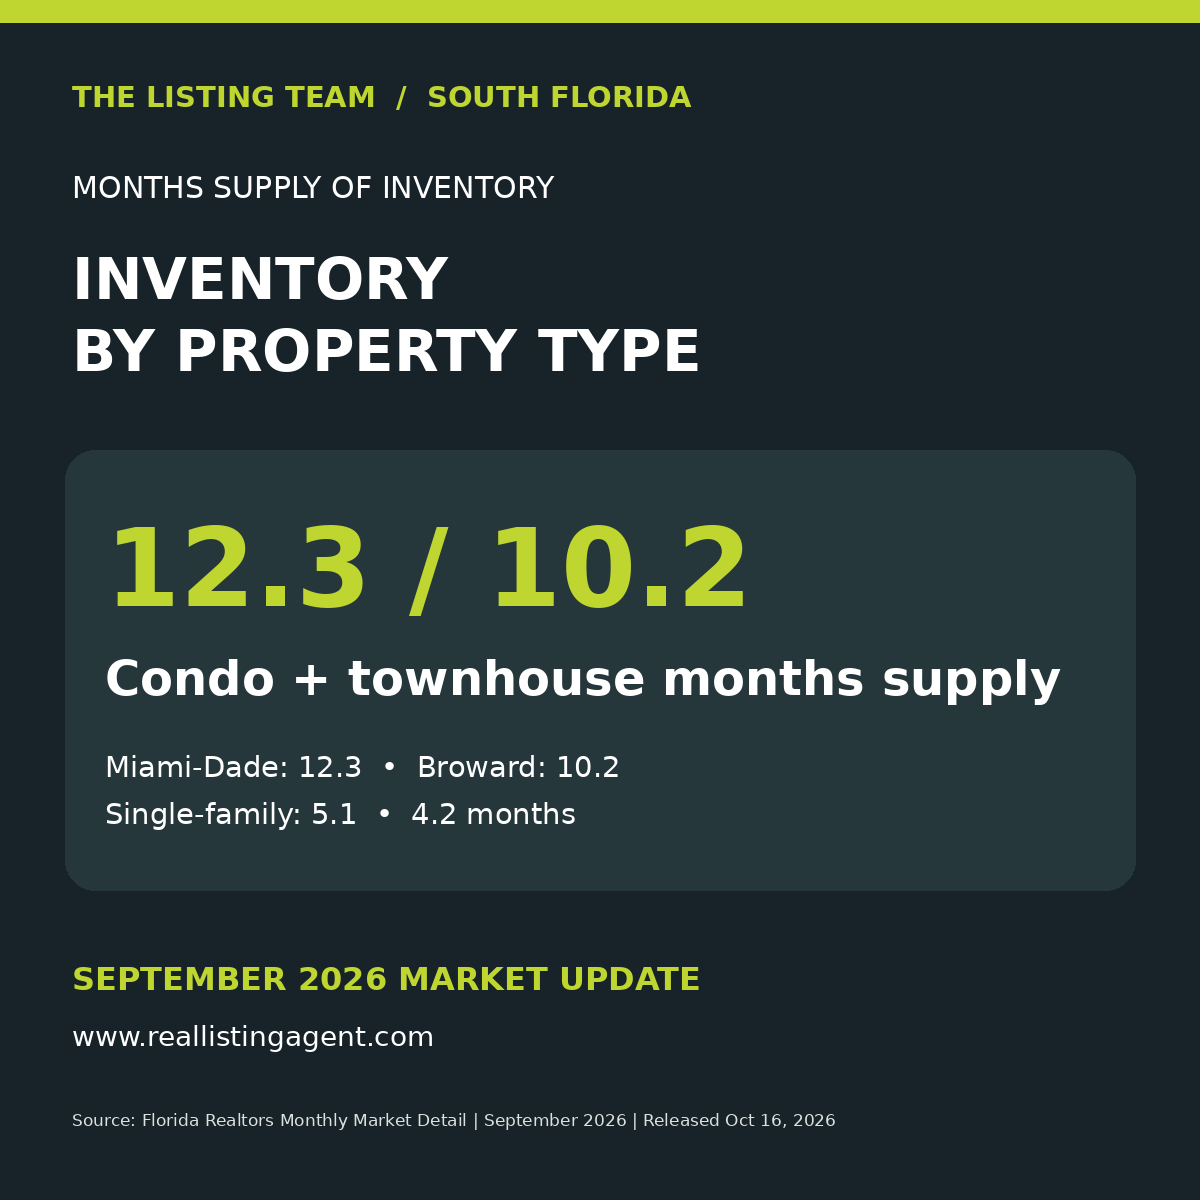
Active listing inventory declined by 16.6% for Miami-Dade single-family homes, 7.2% for Miami-Dade condos and townhouses, 18.1% for Broward single-family homes and 12.0% for Broward condos and townhouses.
Single-family supply measured 5.1 months in Miami-Dade and 4.2 months in Broward. Condo and townhouse supply remained much higher at 12.3 and 10.2 months respectively. Falling inventory does not by itself establish a seller's market; sales pace, pricing and local competition matter.
What this means for South Florida buyers and sellers
For sellers
Accurate pricing, quality photography, presentation and a market-specific strategy remain important. Single-family sellers should compare current competition and recent closed transactions. Condo sellers should consider the larger supply of competing units and review building-specific factors before choosing an asking price.
For buyers
Distinguish between the single-family and condominium markets. The countywide figures suggest very different supply conditions. Before purchasing a condominium, review association budgets, potential assessments, building condition and lender requirements in addition to price.
For homeowners
Year-over-year median sale price changes are not the same as appreciation of a specific property. A comparative market analysis using similar nearby properties provides a more relevant estimate of current market value.
Frequently asked questions
What was Miami-Dade’s median single-family price in September 2026?
$692,000, up 4.1% year over year.
What was Broward’s median single-family price?
$641,500, up 2.4% year over year.
How did Broward condo prices change?
The median condo and townhouse sale price was $235,000, down 14.5% year over year.
Explore South Florida homes and request a valuation
Browse current South Florida property listings or request a property-specific valuation to understand how September’s market data relates to your neighborhood.
Get a local market strategy
Work with The Home Owners Listing Team to evaluate pricing, competition and marketing options.
Free Home Valuation View Listings Contact The Home Owners Listing TeamSource: Florida Realtors® Monthly Market Detail, September 2026, using Florida multiple listing service data. Released October 16, 2026. Original report supplied by The Home Owners Listing Team. Figures compare September 2026 with September 2025. Statistics are countywide and are not property-specific appraisals.
Image publishing note: Image URLs were supplied by The Home Owners Listing Team; verify that each image loads before publishing. No analytics or tracking scripts are included.